What is Info-graphics ?
The infographics are image created to represent the particular ideas and data sheet . Your bigger ideas can express in simple image and express your thousand of word in a image.
Today the best Visual presentation is Infographic method. Visual information always easy to understand the theme very easily and quickly.
Today we can design the info-graphics using many data visualization tools and available in online as a free or premium tools .
I have try to make a list of free data visualization tools in below .
1. Visual.ly
Create your Free Infogrphics in a second. If you want to increase the audience engagement in your website through the visual infographics , try this tool to make your visual content for branding and presentation.
Marketing Manager , Publishers , Thought Leader , Agencies and Creative Professional can use this tool for thier presentation , advertise and promotion .

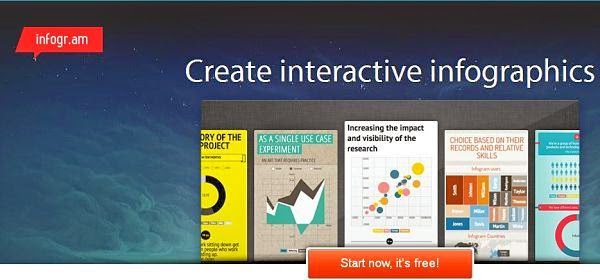
2. infogr.am
Easy way to build your 30+ type charts and treemap to simple pie chart. It has a in-build data-sheet for editing and export in .XLS , .XLSV and .CSV format . save the infography in .pdf and image format.

3. Piktochart
You can select your Theme form more 1000 themes are available. Customized your infographics using the editing tool and you can use more than 1000 image or uploaded images. After creating your infographic , you can able to share and save it in your PC .

4. easelly
Create and share your visual ideas in infographics using easelly infographic tool. You can make the eye-catching and fun graphics on the web. Easelly is suitable for student , business owner and executive who can easily convey a thought , lesson plan and concept in a easy-to-follow the visual form .
easelly is a online infographics tools that provide thousand free infographics templates and design object that will help to make your visual content for shearing in the web .

The infographics are image created to represent the particular ideas and data sheet . Your bigger ideas can express in simple image and express your thousand of word in a image.
Today the best Visual presentation is Infographic method. Visual information always easy to understand the theme very easily and quickly.
Today we can design the info-graphics using many data visualization tools and available in online as a free or premium tools .
I have try to make a list of free data visualization tools in below .
1. Visual.ly
Create your Free Infogrphics in a second. If you want to increase the audience engagement in your website through the visual infographics , try this tool to make your visual content for branding and presentation.
Marketing Manager , Publishers , Thought Leader , Agencies and Creative Professional can use this tool for thier presentation , advertise and promotion .

2. infogr.am
Easy way to build your 30+ type charts and treemap to simple pie chart. It has a in-build data-sheet for editing and export in .XLS , .XLSV and .CSV format . save the infography in .pdf and image format.

3. Piktochart
You can select your Theme form more 1000 themes are available. Customized your infographics using the editing tool and you can use more than 1000 image or uploaded images. After creating your infographic , you can able to share and save it in your PC .

4. easelly
Create and share your visual ideas in infographics using easelly infographic tool. You can make the eye-catching and fun graphics on the web. Easelly is suitable for student , business owner and executive who can easily convey a thought , lesson plan and concept in a easy-to-follow the visual form .
easelly is a online infographics tools that provide thousand free infographics templates and design object that will help to make your visual content for shearing in the web .
